

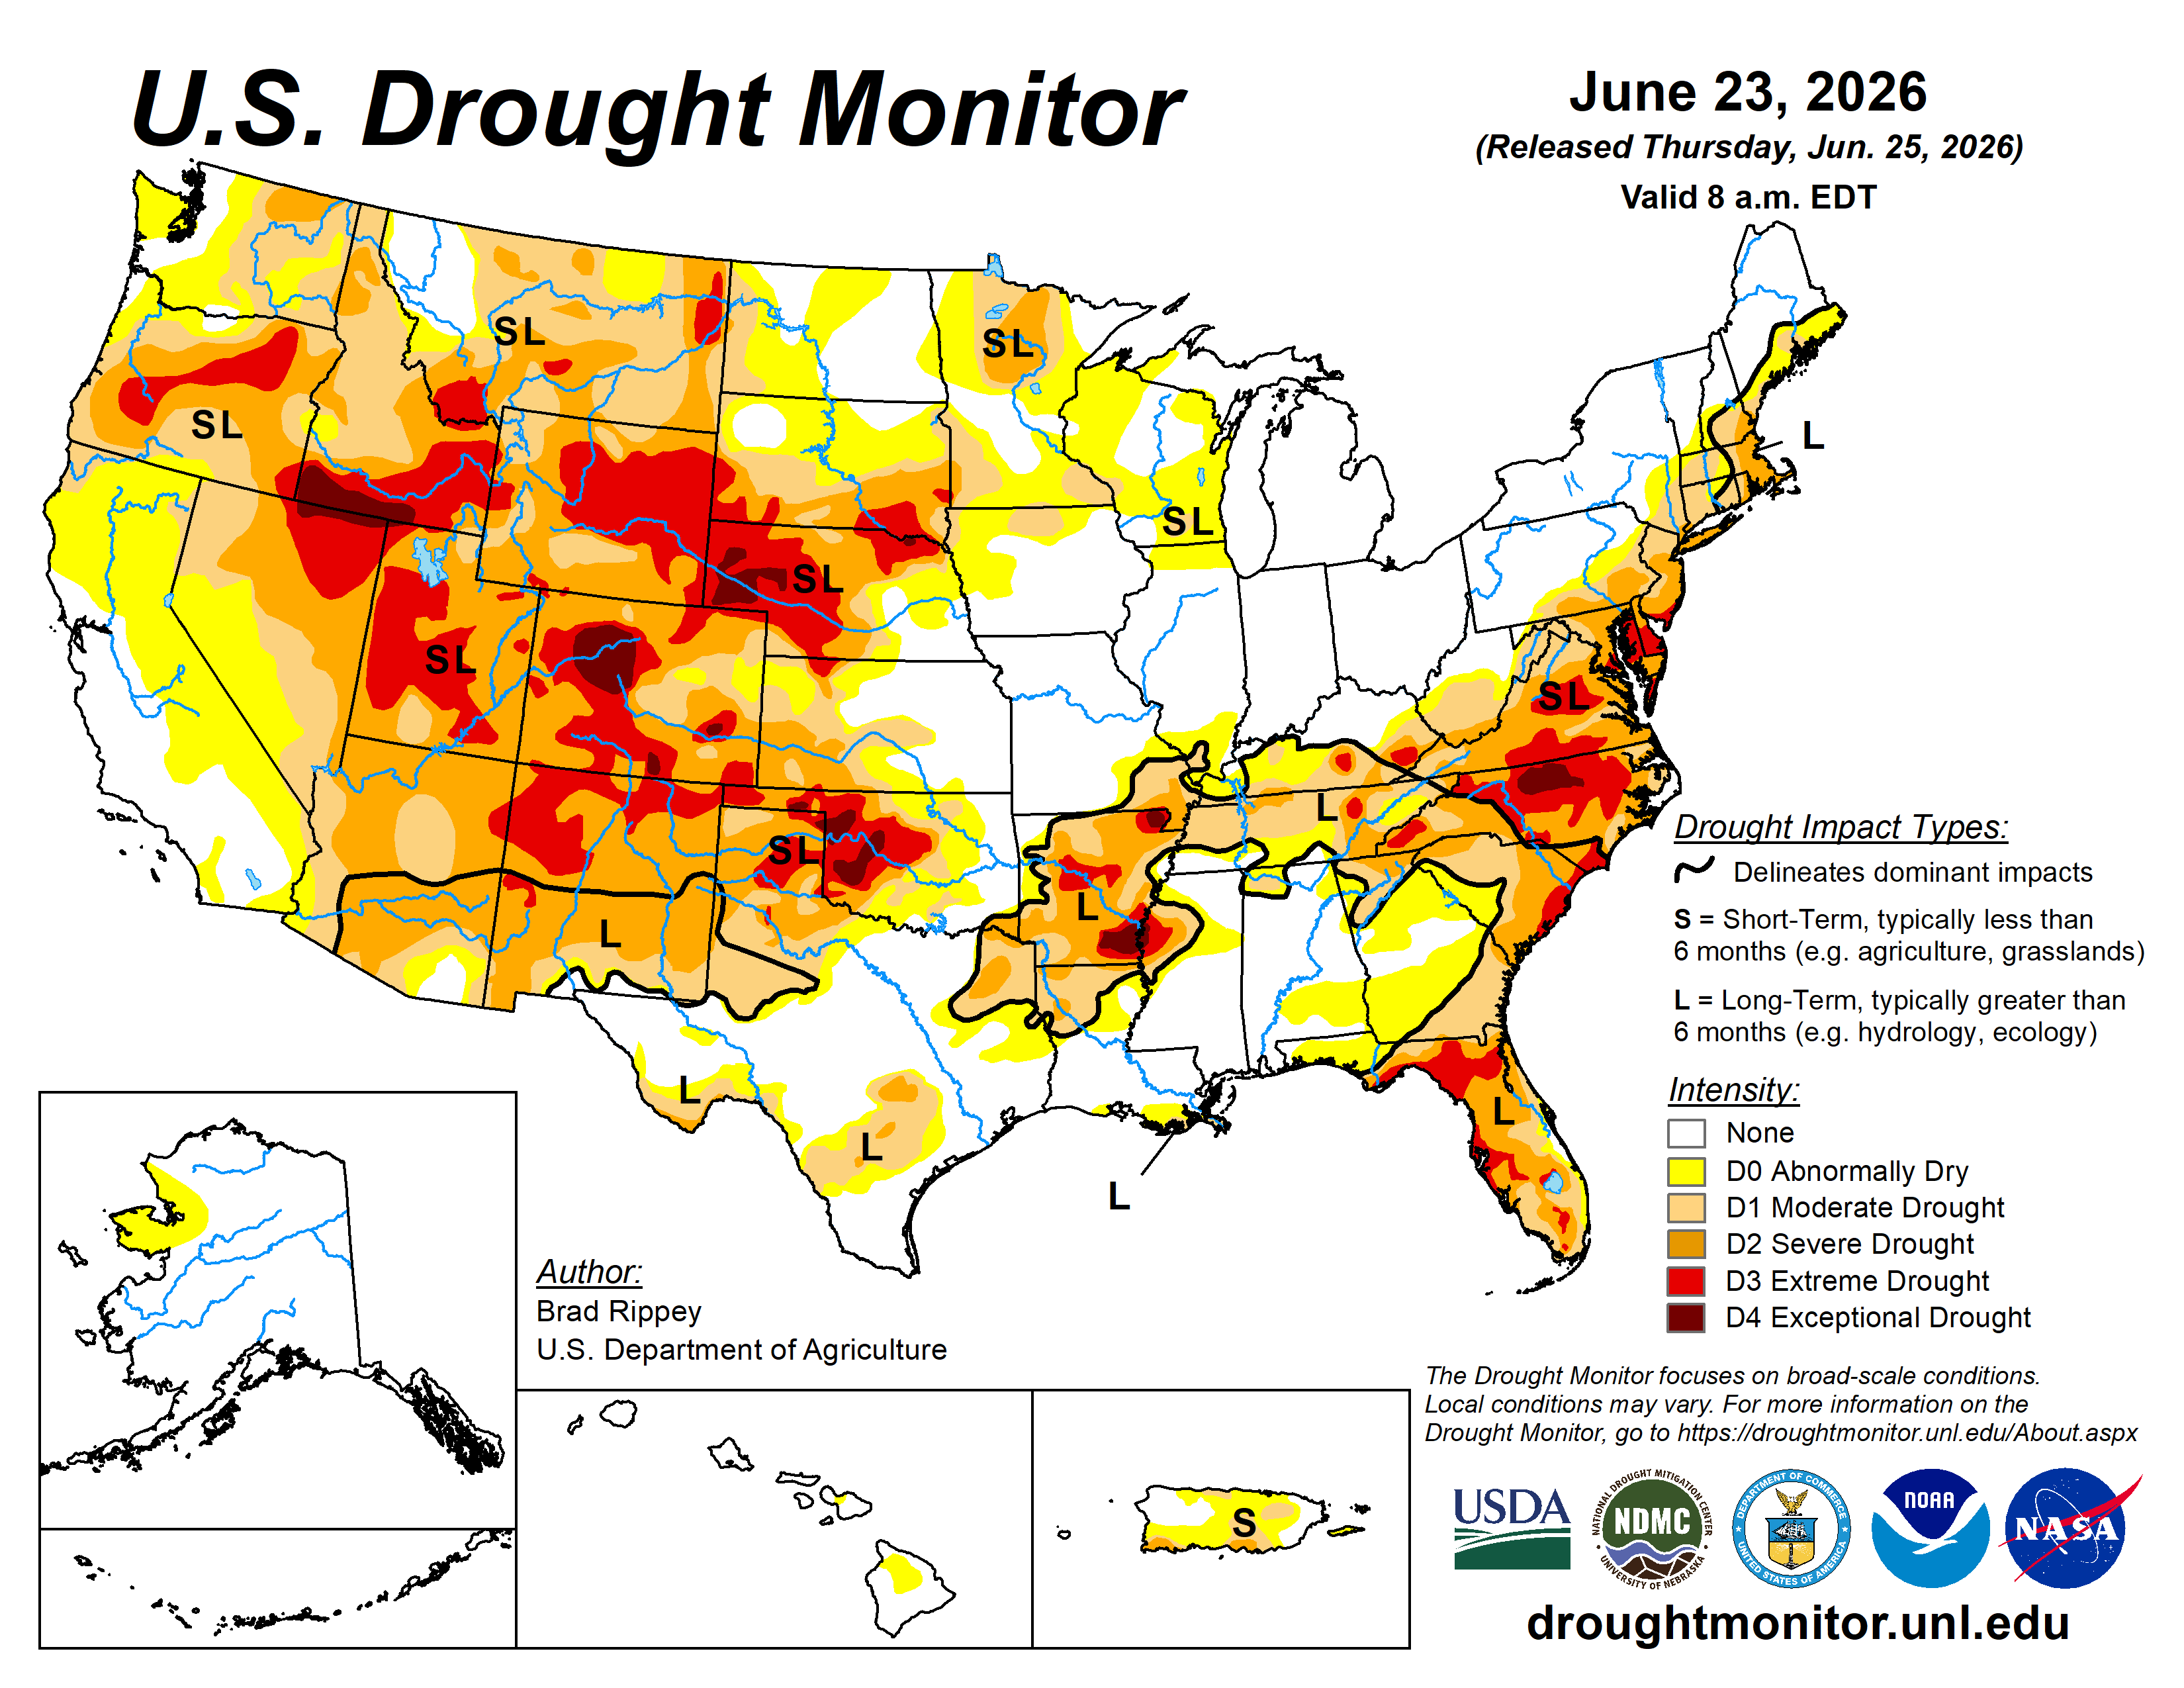
As you’re sweltering in the heat and humidity this weekend, let’s think about rain and take a look at the drought situation. It’s definitely better across the Southeastern US, here’s the last week of April vs. this week. Click any image to embiggen …

At least here in midtown SAV, the deep soil moisture is starting to recover. If you look at the soil moisture, at the end of April we were so dry it was at the sensor limit. Here is a plot for the last 60 days. The blue dots/black average line is the percent of available (to plants) soil moisture six inches below the surface. The purple lines show rain events:

The first bit of serious rain we got in early May duped a lot of plants in to trying to recover, but notice how quickly the curve starts to drop in to critically dry territory. We plant wildflowers for the bees and butterflies, and most of it sprouted and died off. The other problem is a lot of that rain just ran off because the soil was so dry it couldn’t soak in.
That several days of rain the end of May/Early June helped more, but again look how quickly it dried out again, in large part because the deeper layers were so dry. But it did soak in some, but what really helped is the series of rain events we’ve had since mid June. This series of rain events has helped restore the deep moisture – notice that the curve isn’t dropping nearly as fast.
Still, in total, we’re below average for June. With three days left to go, as of this morning we have 5.13″ here in midtown, about an inch below the median value of 6.11″. But note the official total for the month is only 1.38″! This again highlights how variable rain can be from place to place, especially across micro-climates near the coast. Yesterday the airport only got 0.08″, but midtown got 0.59″ out of a small thunderstorm cell.
Overall, the deficit for the year remains high, officially at 11.5″. My deficit is smaller, only 5.25″. Eight of the last nine months have been below normal – in five cases, below the 25% of normal range. Here’s the official drought status for the local area as of this week:
UNL/USDA Drought Monitor Data
Percent of each county in specified level drought or higher.
| County | State | None | D0 | D1 | D2 | D3 | D4 |
|---|---|---|---|---|---|---|---|
| Chatham County | GA | 0.00 | 100.00 | 100.00 | 33.18 | 0.00 | 0.00 |
| Effingham County | GA | 0.00 | 100.00 | 100.00 | 86.69 | 0.00 | 0.00 |
| Liberty County | GA | 0.00 | 100.00 | 100.00 | 0.00 | 0.00 | 0.00 |
| Bulloch County | GA | 0.00 | 100.00 | 70.35 | 0.00 | 0.00 | 0.00 |
| Beaufort County | SC | 0.00 | 100.00 | 100.00 | 100.00 | 0.00 | 0.00 |
| Jasper County | SC | 0.00 | 100.00 | 100.00 | 100.00 | 0.00 | 0.00 |

In short, yes, better, but we still need more rain. Hopefully we will continue to get periodic rain events to continue to condition the deep soil levels and truly break the drought.
If you appreciate the blog, the best way to get it is to subscribe to the emails. You can subscribe and also donate to keep it going at this link. Many thanks to those who have contributed to the blog!
You can also follow us on Musk’s Madhouse X/Twitter (@EnkiResearch), Telegram, BlueSky, or even Facebook if that is your preferred social media quagmire. But be aware that social media algorithms don’t like to show you posts in chronological order. They “upgrade” sensationalist material, and “downgrade” posts that have outside links in order to keep you on their platform, so it’s not a great way to get weather warnings or news (or anything other than a bad case of the vapours, really).
indigestion