

Finally a real cold front has brought seriously cooler temps to the region … left is visual band, right is mid-level water vapor. Browns are very dry (click to embiggen):


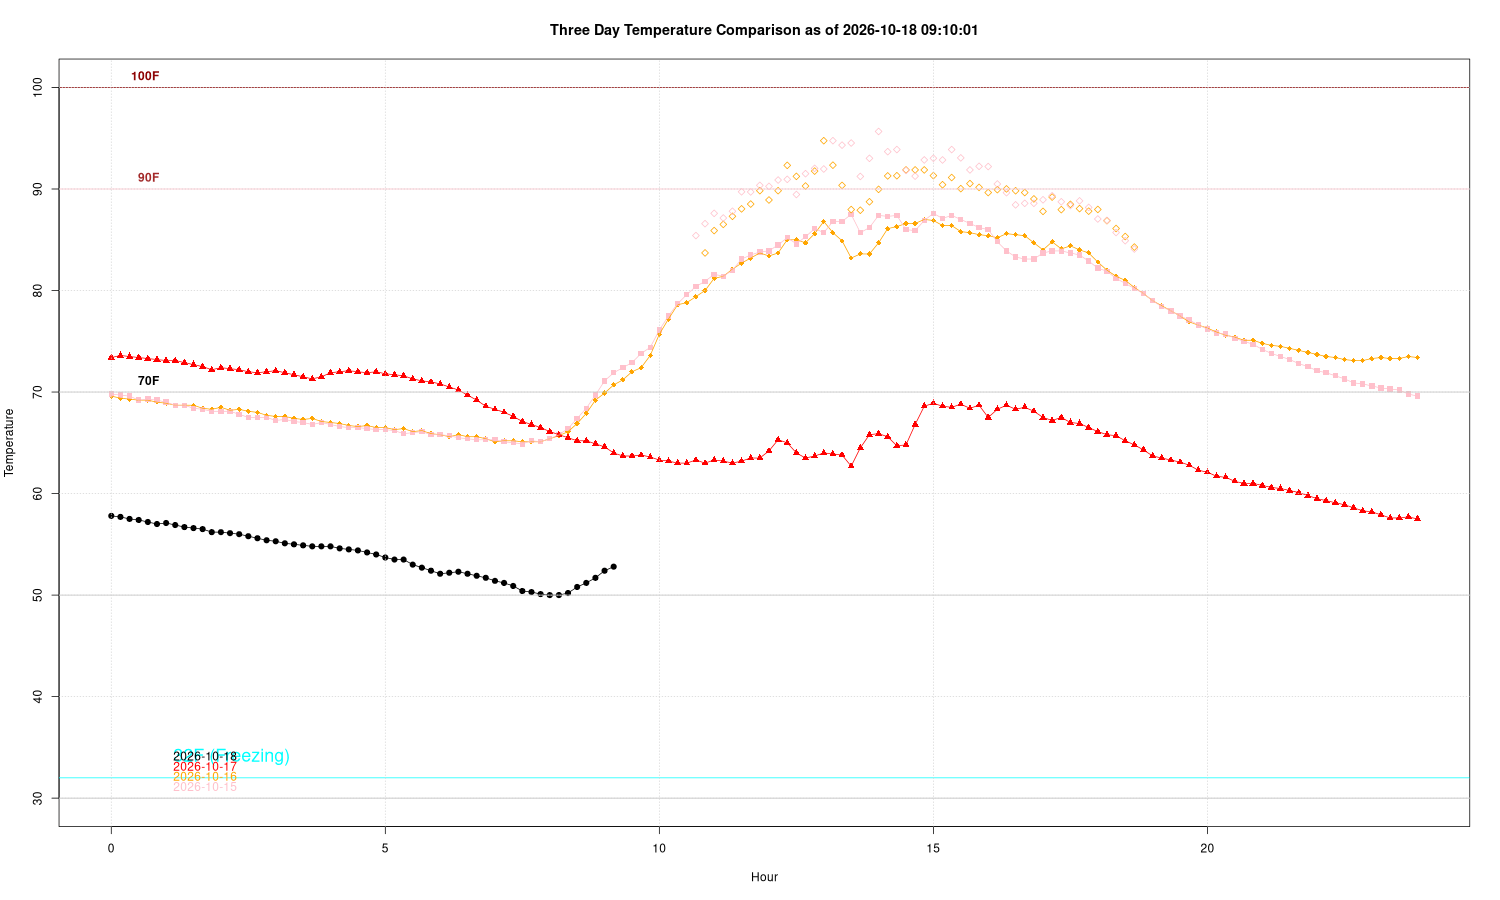
Temperatures dived yesterday. Here is a plot of the last four days, black is this morning up to 9:10am, red is yesterday (Saturday), orange is Friday, and pink Thursday … note the heat index values in the 90’s Thursday/Friday:
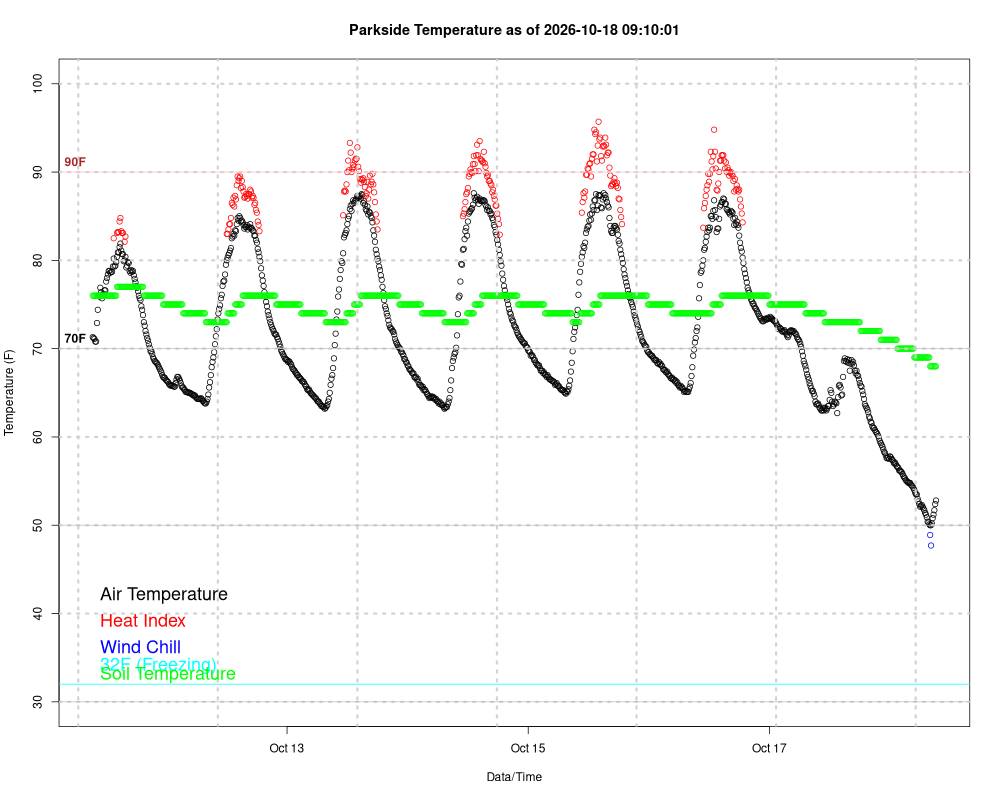
Here’s the plot for the last week. We actually briefly had wind chills this morning into the upper 40’s in downtown Savannah (35 miles south of Frogmore):
Despite our cool-down, it’s still hurricane season in the Northern Hemisphere. Hurricane Trudy is just off the Pacific coast of Mexico, where hurricane warnings are still in effect as it parallels the coast: Key messages regarding Hurricane Trudy (en Español: Mensajes Claves):

Out in the West Pacific, Super Typhoon Champi just missed causing major damage to Guam. The unexpectedly rapid intensification started just south of the Island, with sustained winds jumping from 80mph to 150mph as it passed. Champi is now headed towards the coast of China:

Finally, there is a Yellow Blob of Doom just off the US Atlantic coast:

This is really more of a nor’easter than tropical, but NHC has it tagged. This shows the weirdness of our severe storm monitoring and warning system. A nor’easter, even with tropical storm or hurricane force sustained winds, is treated differently than a hurricane. The Weather Prediction Center and local NWS offices handle them rather than the centralized system like NHC does for hurricanes. Here’s WPC’s key messages for the incipient storm …

And one of the fancy new animation thingees I’m playing with showing the winds over the next three days…
and rain accumulations …
If you appreciate the blog, the best way to get it is to subscribe to the emails. You can subscribe and also donate to keep it going at this link.
While email subscriptions (which are free) are the best way to get these posts, you can also follow us on Musk’s Madness X/Twitter (@EnkiResearch), Telegram, or BlueSky.