

I’ve received several questions about the rain totals this so far this month/year, asking if it’s more than usual. Last year I wrote a post about extremes that you should read if you don’t remember; I won’t repeat the background or discuss the theological implications of Savannah’s drainage system, let’s just look at the last few days and totals to date.
I will again emphasize that convective rain (rain from thunderstorms) is very spatially diverse. Just an example, Savannah International Airport is reporting 36.15 inches so far this year. That’s not much different from the 25 year average of 32.86in. At the Enki office, about eight miles SE of the Savannah Airport near Daffin Park (38.6 miles SW of Frogmore), we have recorded 50.14 inches so far this year!
For the storms the last few days, we got under 2″ at the office. The Airport recorded more (almost 3″), But parts of Pooler got over seven, and south of Richmond Hill got 8-10! Here is the 72 hour rain total map, as calculated from radar data …

You can clearly see on the above map where rain cells “stalled” out or tracked slowly, dumping a lot of water. This is why flooding is such a hard thing to forecast, and why one low lying area might be fine, but another higher area, or an area downstream from where the rain fell, might get flooded. In other words,
Even aside from the nature of convective events, local geography plays a big role in that we have multiple microclimates, not the least of which is a result of the sea breeze fronts that form during summer . But using the official airport data since that at least has a long observation period, here is where we stand for the year as of Thursday:
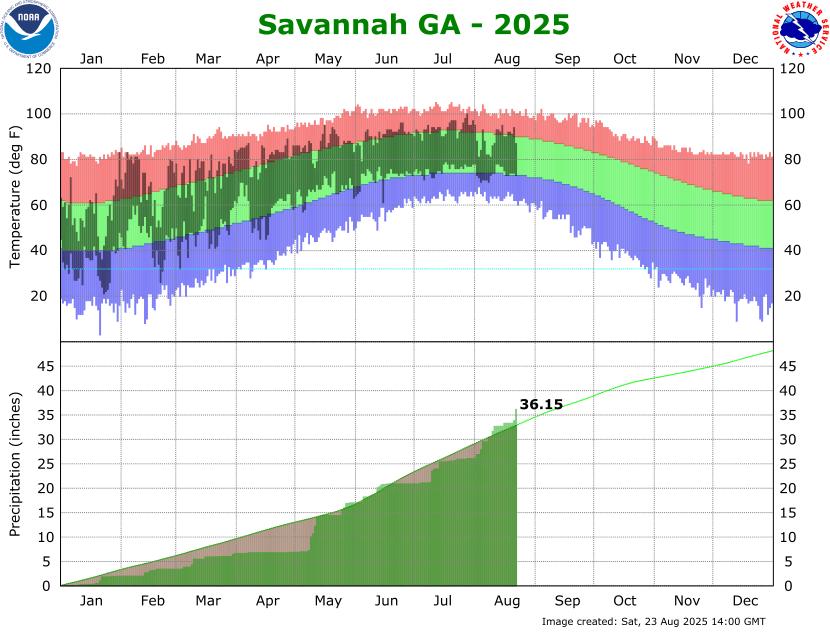
The rain graph is on the bottom. The year was below normal at the start, you can clearly see it was dry from mid March through May and we fell way behind where we should be for the year (the green line). The was a *lot* of rain in mid May that boosted the total back up, where aside from a few dry patches it’s stayed within a couple inches of normal since.
Unfortunately I don’t have the long term data at my station for a statistically sound “average” line, but as noted above at least here there has been a lot more rain here in midtown than the airport during most of these events.
Looking back in history, August and September tend to be the wettest months Savannah. The all time monthly high was 22.88″ in 1924, August 1898 was 22.79″, and July 1964 was 20.10″. The airport is showing 10.07″ so far in August, whereas I’m showing almost 50% more, 14.8″, mostly from the big rain event the 8th that inundated midtown.
As you can probably tell, the answer to the question “are we getting more rain than usual” depends a lot on where you are. I would say yes, because I’ve had to change my routes running errands because of flooded streets. Otherwise, did you get too much (or not enough) rain?

If you like this kind of content, you can subscribe to the emails (and/or donate to shame me in to writing more of it) at this link. You can also follow us on X/Twitter (@EnkiResearch), Telegram, BlueSky, or even Facebook if that’s your preferred social media Dystopia.
Imagine the mud in 1898 and 1924! And the mosquitoes! Thanks for the historical context. Mother Nature can take her umbrella and furl it now as far as I am concerned!
Thank for this and all you do. It is greatly and sincerely appreciated.
It seems to get worse every year. In Richmond Hill, we had entire neighborhoods flooded. Is there something realistic our local politicians can do to make this better, or am I just getting mad at them for no reason? 😂
It’s probably 10-15% climate change and 85-90% bad urban planning, so you have every reason to be mad.